
The United States is a global leader in the livestock and feed sectors in terms of technology, scale, and logistical efficiency. In the 2024-2026 period, total compound feed production reached 270 million tons, with productivity gains and ration optimization taking center stage in the cattle, poultry, and swine sectors. Soy and corn-based production, circular economy practices, and innovative feed additives strengthen the USA’s strategic position in both the domestic market and exports.

By Derya Gulsoy Yildiz
The United States of America (USA) represents one of the most advanced ecosystems in the global livestock and feed industry in terms of technological innovation, production scale, and logistical efficiency. Data from the 2024–2026 period confirms that the U.S. livestock economy is not merely a food production mechanism, but a powerhouse at the center of vertical integration and digitalization, boasting a massive economic footprint of $267.1 billion. The country is reinforcing its leadership in animal protein production and industrial feed technologies through productivity gains, circular economy practices, and the modernization of regulatory frameworks. With a total compound feed production volume reaching 270 million tons in 2024, the U.S. feed sector stands as a strategic actor that determines global commodity balances.
LIVESTOCK SECTOR AND ANIMAL PROTEIN CONSUMPTION
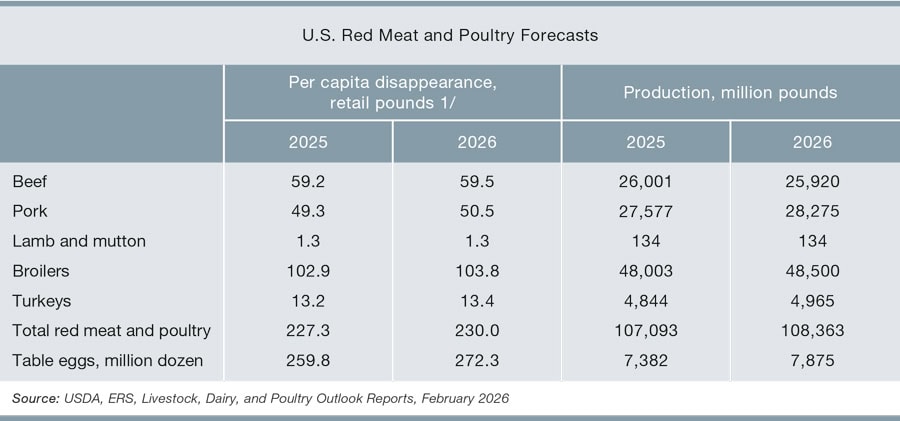
While the U.S. livestock sector has historically been centered on red meat, a shift in modern consumer preferences and economic factors has led to aggressive growth in poultry consumption. According to USDA reports, total red meat and poultry consumption is estimated to have reached 227.3 pounds (103.1 kg) per capita in 2025. This figure is projected to rise to 230 pounds (104.3 kg) in 2026. This level of demand has accelerated the transformation of the livestock sector from traditional family farms into technology-driven, capital-intensive industrial complexes. Providing more than 80,000 direct jobs and contributing $18.5 billion in annual tax revenue, the sector remains one of the primary drivers of rural development.
Beef and Dairy Sector: Historical Contraction and Price Pressure
The U.S. beef sector is undergoing one of the most critical phases of a biological contraction cycle during the 2024–2026 period. The decline of the U.S. cattle inventory to 86.2 million head at the beginning of 2026 indicates that the sector has continued to shrink for the seventh consecutive year. Rising input costs, driven by a reduction in pasture quality due to drought and limited feed capacity, are prompting producers to direct breeding females to slaughter. While this situation increases slaughter numbers in the short term, it leads to a reduction in herd size and causes a decline in beef production in the medium term. According to recent reports, total beef production in the country, which was 26,001 million pounds (approximately 11.79 million tons) in 2025, is projected to decrease to 25,920 million pounds (approximately 11.76 million tons) in 2026. On the consumption side, per capita beef consumption, which was 59.2 pounds (26.9 kg) in 2025, is expected to remain around 59.5 pounds (27 kg) in 2026.
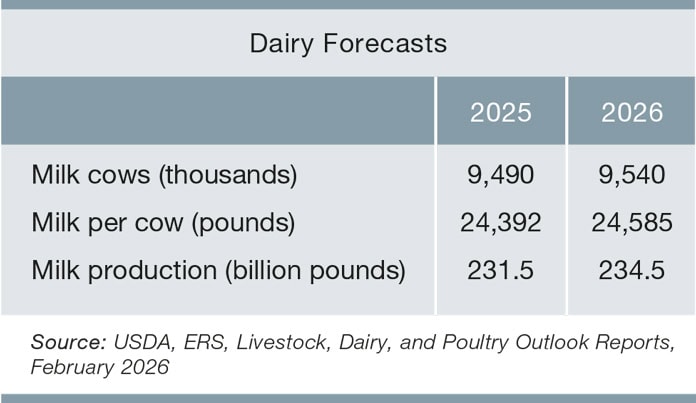
The dairy sector exhibits a more technology-intensive and efficiency-oriented structure compared to the beef sector. The increase in milk yield per cow to 24,392 pounds (11,065 kg) in 2025 is a result of improved nutritional rations and herd management technologies. This yield is expected to reach 24,585 pounds (11,152 kg) in 2026. However, dairy farming operations are under significant margin pressure due to volatile milk prices and high interest rates. Current projections indicate that despite the decline in the number of dairy cows, the increase in yield per animal will drive total milk production from 231.5 billion pounds (approx. 105.0 million tons) in 2025 to 234.5 billion pounds (approx. 106.37 million tons) in 2026.
Poultry and Egg Sector: The Dominant Force in the Market
The poultry sector is the most resilient and fastest-growing branch of U.S. livestock. Broiler (meat-type chicken) meat has become the “budget-friendly” protein choice for consumers due to price increases in beef. Broiler meat production, which was 48,003 million pounds (approx. 21.77 million tons) in 2025, is estimated to reach 48,500 million pounds (approx. 22.00 million tons) in 2026. On the consumption side, per capita broiler consumption—which hit a historical record of 102.9 pounds (46.7 kg) in 2025—is projected to climb further to 103.8 pounds (47.1 kg) in 2026.
In the layer industry, the U.S. poultry sector is contending with risks posed by Highly Pathogenic Avian Influenza (HPAI) outbreaks. Current estimates show that egg production dipped to 7,382 million dozen (approximately 88.6 billion units) in 2025 due to disease pressure; however, modern facilities are beginning to absorb these shocks through biosecurity investments. Production is projected to rebound in 2026, reaching 7,875 million dozen (approximately 94.5 billion units). Annual per capita egg consumption in the country is estimated at approximately 260 units for 2025, representing a significant decline compared to previous years. Nevertheless, current forecasts indicate this figure will rise again in 2026, reaching 272 units.
Pork Sector
Standing out for its high biosecurity standards and level of integration, the U.S. pork sector maintains its production capacity through productivity gains. Although the breeding herd size has remained stable, total pork production rose by 3% in 2025 to reach 27,577 million pounds (approximately 12.51 million tons) due to increased yield per animal. This volume is projected to rise to 28,275 million pounds (approximately 12.82 million tons) in 2026. This productivity growth is supported by continuous improvements in the litter rate (number of piglets per litter). On the consumption side, per capita pork consumption reached 49.3 pounds (22.4 kg) in 2025 and is estimated to hit 50.5 pounds (22.9 kg) in 2026. Additionally, the country exports approximately 25% of its total pork production.
Aquaculture Sector
Despite high consumption levels, the U.S. aquaculture sector is characterized by a heavy reliance on imports due to limited domestic production capacity. Current estimates indicate that 75–90% of seafood consumed in the U.S. is met through imports. While annual commercial fishing production reached approximately 8.4 billion pounds (3.8 million tons) in 2023, aquaculture production stands at around 688 million pounds (approximately 312,000 tons). Annual per capita seafood consumption was recorded at approximately 20.8 pounds (9.4 kg) in 2022. Nevertheless, the aquaculture sector stands out as a relatively small but one of the most technologically innovative segment of the U.S. agri-food system. Investments in high-value species (salmon, trout, bass, and shrimp), Recirculating Aquaculture Systems (RAS), precision feeding technologies, and sustainable feed ingredients—such as insect protein and algae oil—are enhancing the sector’s long-term growth potential.
 INDUSTRIAL FEED PRODUCTION AND CONSUMPTION IN THE USA
The United States is the world’s second-largest producer of compound feed. According to the 2025 Alltech Agri-Food Outlook report, global compound feed production reached approximately 1.4 billion metric tons in 2024. North America accounted for 291 million metric tons (20.8%) of this global total. As the largest producer in the region, the US alone accounted for 270 million metric tons (approximately 92.8%) of this production, representing a slight increase of 0.68% compared to the previous year. This massive volume is the collective output of approximately 5,650 feed mills, supported by advanced logistical networks and an abundance of raw materials.
U.S. ruminant feed production represents approximately 41.6% of the country’s total feed output. In 2024, out of the total ruminant feed production of around 112 million metric tons, the largest portion—approximately 71 million metric tons—was attributed to beef feed. During the same period, the total amount of dairy feed produced in the country was approximately 42 million metric tons.
The production within the U.S. ruminant feed segment is supported by modern feed optimization technologies and nutritional programs that enhance animal performance. Through feed quality control and ration optimization, farms aim for maximum performance in both growth and milk yield. Furthermore, sustainability trends are gaining prominence in the sector; some producers are implementing circular economy practices by increasing the use of by-products and upcycled ingredients.

In 2024, poultry feed production reached approximately 72 million tons, representing the second-largest segment and accounting for 26.7% of total compound feed production in the USA. Within the poultry category, broiler feed production stood at approximately 57 million metric tons in 2024, corresponding to 21% of the country’s total compound feed output. During the same period, layer feed (egg production feed) reached approximately 15 million metric tons.
The poultry sector in the U.S. stands out with its intensive vertical integration and automation. Production facilities manage almost every stage of the production process—from feed manufacturing to grow-out—under a single organizational umbrella. This structure allows for rations to be optimized on a weekly basis, significantly improving feed conversion efficiency. Furthermore, modern facilities utilize substantial biosecurity investments and control systems to minimize disease risks. This segment possesses rapid growth potential in both the broiler and layer sub-sectors and supports the industry’s overall efficiency and sustainability goals.
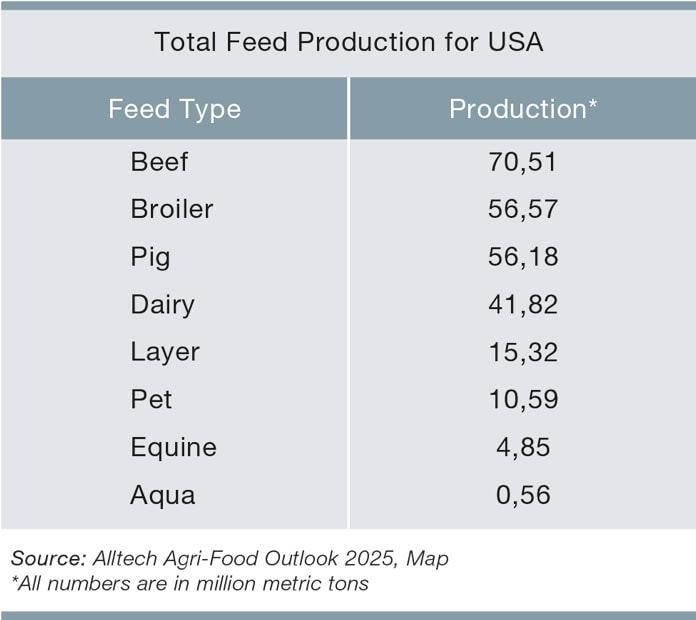 In 2024, pig feed production reached 56 million metric tons, representing 20.8% of the total compound feed production in the USA. In this segment, productivity and production standards are of primary importance. Producers enhance animal performance per head by utilizing mixtures with high balance protein and energy balance. Furthermore, the sector maintains high biosecurity and hygiene standards, while initiatives for the use of sustainable ingredients are becoming more widespread. These practices contribute to supporting both growth and export potential.
The U.S. pet food sector, which produced approximately 11 million metric tons in 2024, stands out as the most profitable and resilient segment of the country’s feed industry. Growth in this segment is directly linked to the “humanization of pets” trend; consumers now demand functional nutrients, fresh/frozen ingredients, and premium products for their pets. Pet food manufacturers led the entire feed industry in sustainability in 2024 by utilizing more than 4.1 million tons of upcycled ingredients.
In the aquafeed segment, production volume remains quite limited. According to current reports, U.S. aquafeed production in 2024 totaled 560,000 tons, accounting for a very small fraction—approximately 0.2%—of total feed production. Despite its small volume, aquafeed is a segment that requires high nutrient density and specialized formulations. In the U.S., the nutrition of fish and crustacean species is managed through precision feeding technologies, supporting the farming of high-value species. Furthermore, the segment holds significant future growth potential through the use of sustainable ingredients (such as insect protein and algae oil) and Recirculating Aquaculture Systems (RAS).
On the consumption side, the most current data pertains to 2023. According to a comprehensive report published in 2025 by IFEEDER in partnership with AFIA and NARA, a total of 283.6 million tons of feed were consumed in the U.S. in 2023. Beef cattle feed took the lion’s share of this consumption at 76.7 million tons, followed by broiler feed at 61.5 million tons, pig feed at 60.9 million tons, dairy feed at 48.7 million tons, and layer feed at 17.7 million tons.
STRUCTURAL SHIFTS IN FEED RAW MATERIALS AND THE “CIRCULAR” FUTURE
The raw material composition of the U.S. feed sector relies heavily on corn and soybean meal. However, the strategy to reduce soy inclusion is primarily driven by “resource efficiency” and “circular economy” goals. The sector is a global pioneer in transforming by-products from the human food industry into high-quality animal feed.
Corn and Energy Sources
Corn remains the unshakeable cornerstone of U.S. feed rations and serves as the primary energy source in diets. Additionally, Distillers Dried Grains with Solubles (DDGS), a co-product of corn ethanol production, is heavily consumed to provide both energy and protein balance in rations.
The United States alone accounts for approximately 378.3 million tons—or 30.8%—of the global corn production, which reached 1.23 billion tons in the 2024/25 season. This production is expected to remain strong in the 2025/26 season, reaching 432.3 million tons, which is anticipated to keep feed prices under control.
Soybean Meal and Export Dynamics
The United States is one of the largest suppliers in the global soybean market. In the 2024/25 season, the U.S. accounted for 128.6 million metric tons—or 30.1%—of the 427.2 million metric tons produced globally. Regarding soybean meal, the U.S. produced 55.3 million metric tons (19.6%) of the 281.9 million metric ton global total during the same season. Projections for the 2025/26 season indicate a decline in soybean production but an underlying strength in soybean meal output. According to these forecasts, 2025/26 soybean production will reach 115.9 million metric tons, while soybean meal production is expected to reach 55.1 million metric tons.
Soybean meal, an indispensable part of domestic poultry and pig rations, is also a significant export item for the USA. In the 2024/25 season, the country exported 16.8 million metric tons of its production.
Circular Ingredients and the “Upcycling” Strategy
One of the most unique aspects of the U.S. feed industry is the integration of agricultural and industrial by-products into rations. Today, 37% of livestock feed and 50% of pet food consist of “circular” or upcycled ingredients. These ingredients encompass fruit and vegetable pulp, spent grains from the human food chain, and animal by-products. Rendered products (animal fats and protein meals) make a critical contribution to sustainability goals by reducing the carbon footprint by up to 50%. However, the past five years have seen a 25% decrease in the share of animal protein meals in rations, indicating a shift toward diets more focused on plant-based proteins and synthetic amino acids.

THE FEED ADDITIVES MARKET IN THE USA
The U.S. feed additives market is growing rapidly as a critical field that bridges livestock productivity and sustainability. According to recent reports, the sector is expected to reach a volume of $7.55 billion in 2026, with a particular shift toward natural and functional additives that replace Antibiotic Growth Promoters (AGPs). The most significant development accelerating this transition is the “Innovative FEED Act” regulation; this new legislation will shorten the approval processes for substances that influence the gut microbiome or reduce emissions, enabling the FDA to rapidly evaluate them as feed additives.
Trends in the sector are shifting toward functional additives and micro-nutrition solutions. Probiotics, enzymes, and optimized amino acids are being used more intensively in rations to both increase productivity and reduce environmental impact. Furthermore, artificial intelligence (AI) and data-driven systems ensure that these products are applied at the correct dose per animal and according to specific needs, thereby minimizing waste.
This integrated structure ensures that the U.S. feed additives market remains a leader not only in terms of scale but also in its capacity for technological and sustainability-focused innovation.
The Top 10 Feed Producers
in the U.S.1. Cargill
2. Land O’Lakes
3. Tyson Foods
4. Wayne-Sanderson Farms
5. Alltech
6. Smithfield Foods
7. ADM Animal Nutrition
8. Koch Foods
9. Mountaire Farms
10. Perdue Farms
FEED MILLS AND PRODUCTION INFRASTRUCTURE
The U.S. feed industry, which includes approximately 5,650 feed mills, is built upon vertical integration and massive-scale facilities. In 2024, 38% of the total regional compound feed production—amounting to 110.8 million metric tons—was carried out by the 30 largest feed companies in North America. Notably, 27 of these top 30 companies are based in the United States.
Feed production facilities in the U.S. range from small-scale local mills to fully automated and digitally controlled mega-plants with annual capacities exceeding millions of tons. These large-scale facilities, concentrated primarily in the Midwest and the Southern states, play a critical role in corn and soy-based compound feed production. This infrastructure not only boosts production volume but also enables ration optimization, energy efficiency, and the minimization of logistical costs.
In terms of regional distribution, the states of Illinois, Iowa, Minnesota, Arkansas, and Georgia serve as the hubs with the highest production capacities. These facilities, each capable of producing around 5–10 million tons of compound feed annually, represent the strategic infrastructure that supports both U.S. feed exports and domestic supply security. Furthermore, modernization efforts in the industry have gained momentum through the renovation of previously small and inefficient plants, alongside the integration of energy-efficient equipment and eco-friendly processes.
CONCLUSION AND FUTURE PROJECTIONS
The United States livestock and feed sector is navigating a period of “transition and efficiency” between 2024 and 2026. While the biological contraction in the beef sector triggers a search for higher efficiency in rations, the poultry and pig segments continue to serve as the market’s primary engines of growth. The most significant transformation in the industry is the zootechnical nutritional revolution, which is gaining legal standing through the “Innovative FEED Act.”
In the coming decade, the primary engine of growth in the U.S. feed market will shift from volume expansion toward “precision nutrition” and “low-carbon production.” Key areas such as premiumization in pet food, AI-supported feeding technologies, and methane-reducing additives are emerging as the most attractive fields for global investors. As U.S. giants increase their economies of scale through strategic mergers, the sector will become more resilient to global commodity market uncertainties, strengthening the United States’ position as the technological hub defining the future of animal protein production.
References:
1. Alltech Agri-Food Outlook 2025, https://www.alltech.com/agri-food-outlook/results
2. Animal food state of the industry report released, Feedstuffs, September 2025, https://www.feedstuffs.com/agribusiness-news/animal-food-state-of-the-industry-report-released
3. United States cattle inventory down slightly, USDA National Agricultural Statistics Service, https://www.nass.usda.gov/Newsroom/2026/01-30-2026.php
4. Livestock and Poultry Outlook, USDA, February 2026, https://www.usda.gov/sites/default/files/documents/2026AOF-livestock-poultry-outlook.pdf
5. Livestock, Dairy, and Poultry Outlook: February 2026, Economic Research Service – USDA, https://ers.usda.gov/sites/default/files/_laserfiche/outlooks/113844/LDP-M-380.pdf
6. North America Animal Feed Market – Forecasts from 2025 to 2030, Market Research, December 2024, https://www.marketresearch.com/Knowledge-Sourcing-Intelligence-LLP-v4221/North-America-Animal-Feed-Forecasts-40960851/
7. Aquaculture, Economic Research Service – USDA, September 2025, https://www.ers.usda.gov/topics/animal-products/aquaculture
8. Fisheries of the United States 2023, February 2026, NOAA Fisheries Office of Science and Technology
Fisheries Statistics Division, https://s3.amazonaws.com/media.fisheries.noaa.gov/2026-02/FUS-2023-web.pdf
9. Animal Feed Consumption, February 2025, The Institute for Feed Education and Research (IFEEDER), https://www.afia.org/pub/?id=0e89a761-ca2e-f503-29dd-dc7ae4f2d3dc
10. 2024-25 State of the U.S. Animal Food Industry Report, AFIA, https://www.afia.org/pub/?id=7698c5ea-d1ee-8271-f0be-3bafd924e12e
11. Pet Food Production and Ingredient Analysis, IFEEDER, March 2025, https://www.afia.org/pub/?id=acc22f76-f91e-ba27-3fdd-7cc941cb1c34
12. Grain: World Markets and Trade | USDA Foreign Agricultural Service, February 2026, https://www.fas.usda.gov/sites/default/files/2026-02/grain.pdf
13. Oilseeds: World Markets and Trade | USDA Foreign Agricultural Service, February 2026, https://www.fas.usda.gov/sites/default/files/2026-02/oilseeds.pdf
14. United States Feed Additives Market Size & Share Analysis – Growth Trends and Forecast (2026 – 2031), Mordor Intelligence, https://www.mordorintelligence.com/industry-reports/us-feed-additives-market-industry
15. Congressman Langworthy Introduces Bill to Support American Farmers on National Agriculture Day, March 2025, https://langworthy.house.gov/media/press-releases/congressman-langworthy-introduces-bill-support-american-farmers-national
16. Special report: Top 20 US feed manufacturers, Feed Strategy, January 2025, https://www.feedstrategy.com/animal-feed-manufacturing/article/15711734/top-20-us-feed-manufacturers
17. United States Compound Feed Market Size & Share Analysis – Growth Trends & Forecasts (2025 – 2030), Mordor Intelligence, https://www.mordorintelligence.com/industry-reports/united-states-compound-feed-market
18. 2025 North American Top Feed Companies: 30 manufacturers reach 1 million metric tons of production volume, Feed & Grain, February 2026, https://www.feedandgrain.com/animal-feed-manufacturing/article/15773510/2025-north-american-top-feed-companies-30-manufacturers-reach-1-million-metric-tons-of-production-volume


