
Forage quality cannot be reliably assessed by appearance alone. Accurate forage testing provides essential insight into nutrient composition, digestibility, and potential feeding risks, enabling producers to balance diets more precisely. Understanding key analytical parameters helps ensure that forage effectively supports microbial function, animal health, and productive performance.

Professor and Extension Veterinarian
Penn State University
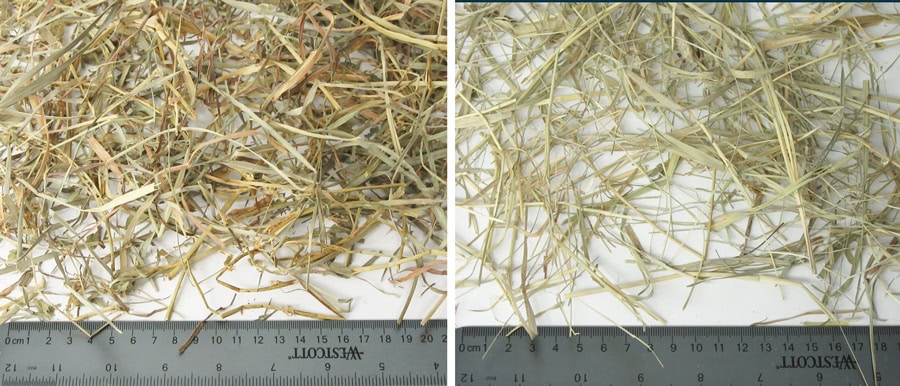
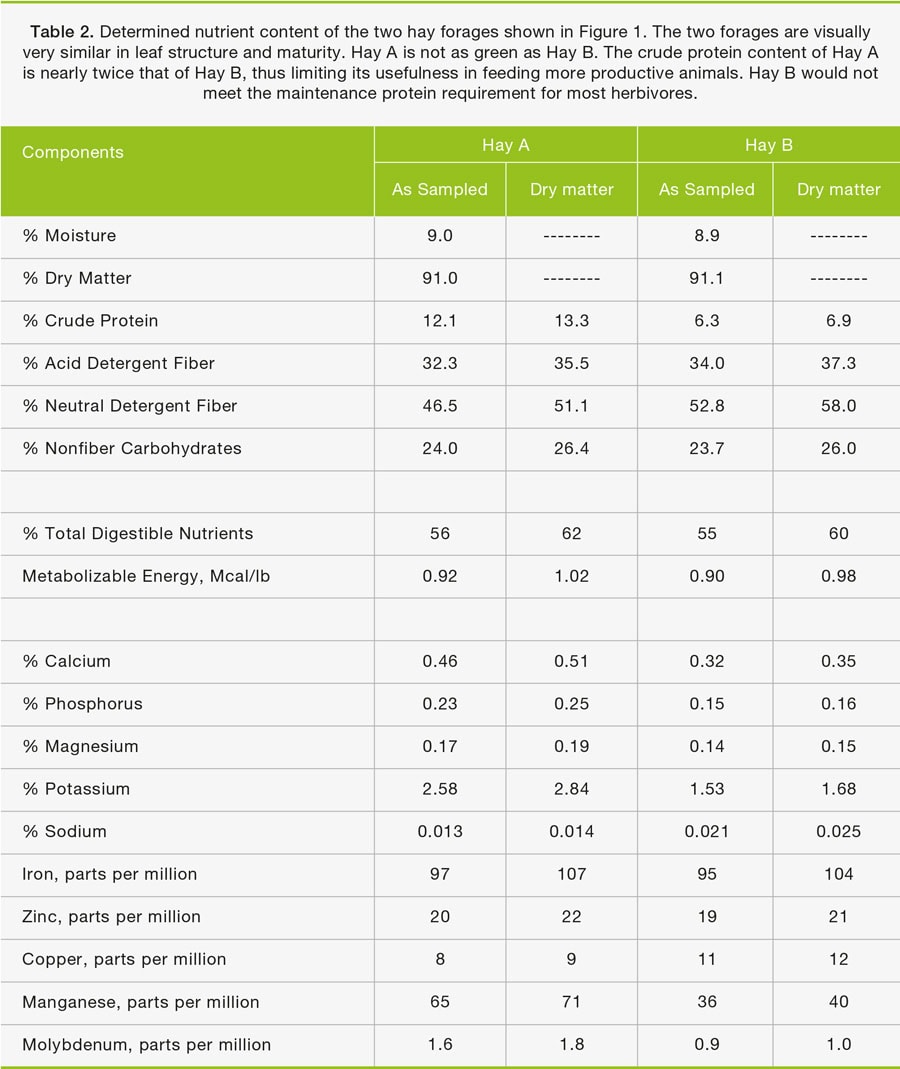
Forage is the foundation of the herbivore diet and the primary source of essential nutrients to support body metabolism and productivity. How well a forage meets the nutritional requirements of a given animal will depend on the nutrient content of the forage being consumed and the amount of forage consumed. The ability of a forage to provide nutrients within a reasonable intake is characterized as “forage quality”. Most animal owners assess forage quality qualitatively through sensory parameters of color, smell, visual, and tactile estimation of maturity (leaf-to-stem ratio; rigidity of stems). An example of the limitation to visual differentiation of forage quality is provided in Figure 1. Producers’ use of forage testing through time-tested chemical parameters is limited for a variety of reasons, including costs, frequent forage purchases, and limited interpretive capabilities. However, more complex analytical procedures and biologic parameters are needed to truly differentiate between a higher and lower quality forage and their potential role in meeting microbial and animal needs. A properly balanced diet that meets the needs of the microbial flora and animal is essential to maintaining good health and productivity. An investment in forage testing is the single best way to achieve this end. This article will provide an overview of forage testing and its interpretation as it applies to feeding forage-consuming production animals.
GETTING STARTED: SAMPLING AND LABORATORY SELECTION
Our ultimate goal in spending money to have forage testing completed is to have usable information on nutrient composition to provide a more complete and balanced diet for the animals. The adage “garbage in, garbage out” is applicable here; if we do not obtain a representative sample and have appropriate testing performed, the obtained numbers will not be of much use in fine-tuning your diets. A good place to start is referring to information provided on the National Forage Testing Association (NFTA) website (www.foragetesting.org). Here you can find information on hay probes to collect good samples and appropriate sampling methods to obtain accurate results. This organization has a searchable list of certified laboratories on their website. Use of a certified laboratory provides more confidence in the results obtained. Additionally, these labs are very willing to retest unusual results to confirm the numbers.
 Use of a hay probe is highly recommended in sample collection over taking “grab” samples from various hay bales. One should collect 2-3 cored samples of a minimum of 10% of the hay inventory. Obviously, more is better in obtaining the most representative sample. Different hay harvests should be sampled and tested separately rather than combined. Once the sampling is completed, the material should be mixed thoroughly in a clean, dry bucket then subsampled to send to the laboratory. Subsampling is accomplished by placing your total sample on a clean, impermeable surface and mixing it thoroughly, then using a yard stick or similar implement, divide the mixed material into four quarters. Combine the material from two opposing quarters to make your submitted sample. Communicate with the laboratory to determine the desired amount of sampled forage to send that is necessary to complete all the desired testing. If you send too much material, the laboratory will need to take a subsample, which may not be a representative sample of your forage. A simple Google search for “forage sampling methods” will provide several good extension-based videos on forage sampling techniques.
Box A
Suggested nutrient parameters for feed testing
• Moisture/Dry Matter
• Crude Protein
• Soluble Crude Protein
• Acid Detergent Insoluble Protein
• Rumen Degradability
• Acid Detergent Fiber (ADF)
• Neutral Detergent Fiber (NDF)
• Lignin
• Degradability of Neutral Detergent Fiber
• Crude Fat or Total Fatty Acids
• Water-soluble Carbohydrates
• Starch
• Ash
• Macrominerals (Ca, P, Mg, K, Na, S)
• Microminerals (Cu, Fe, Mn, Zn, Mo)
• Energy content – calculated
FORAGE TESTING METHODS
Standardized chemical methods of feed analysis were developed more than 200 years ago. The proximate analysis system that includes crude protein (CP), crude fiber (CF), ether extract (EE), and ash have been in use for more than 150 years. This system was not adequate for differentiating feed composition relative to microbial fermentation and animal needs. Newer chemical and biological methods of feed analysis that best relate to nutritional function have been developed over the past 40 years and continue to be developed (Box A). Newer biological methods such as determining rumen degradable protein or neutral detergent fiber degradability are examples of characterizing forage components related to microbial fermentation in feeding ruminant animals.
The gold standard for testing procedures is wet chemistry methodologies. More recently, near-infrared spectroscopy (NIR) methods have been improved and become mainstream for routine analyses. One advantage of using NIR methods is the lower cost. One concern with NIR methods is the inability to accurately assess mineral content. Quality laboratories will indicate what feeds are appropriate for NIR testing as accurate calibrations have not been generated. Most forage samples will have good calibration criteria to assess nutrient content other than minerals.
FEED ANALYSIS TERMINOLOGY
A major hurdle in the use of feed testing and its application is the complex terminology associated with all the parameters determined. Here is a summary of the key parameters on a forage test that should be considered in evaluating the forage quality.
Moisture – Dry Matter. We talk about feeds on an “as fed” and “dry matter” basis relative to a feeding program. When you send a sample to the lab, the feed contains both moisture and dry matter. Dry matter is where all the nutrients are found. The lab will weigh the sample, dry it, then reweigh it to determine the moisture loss, leaving only the dry matter. We want to compare feeds on a dry matter basis to compare “apples to apples” as the moisture content varies. For hay the moisture should be 15% or less. As the moisture increases, the risk of promoting mold growth increases. Mold growth increases the risk for heat generation and spontaneous combustion of hay bales. Moisture content of feeds to be ensiled is critical to successful fermentation. Large round hay bales often have enough moisture to allow mold growth, leading to the degeneration of the forage quality in the center of the bale. This process may become excessive, allowing for the growth of Listeria or the organism causing botulism.
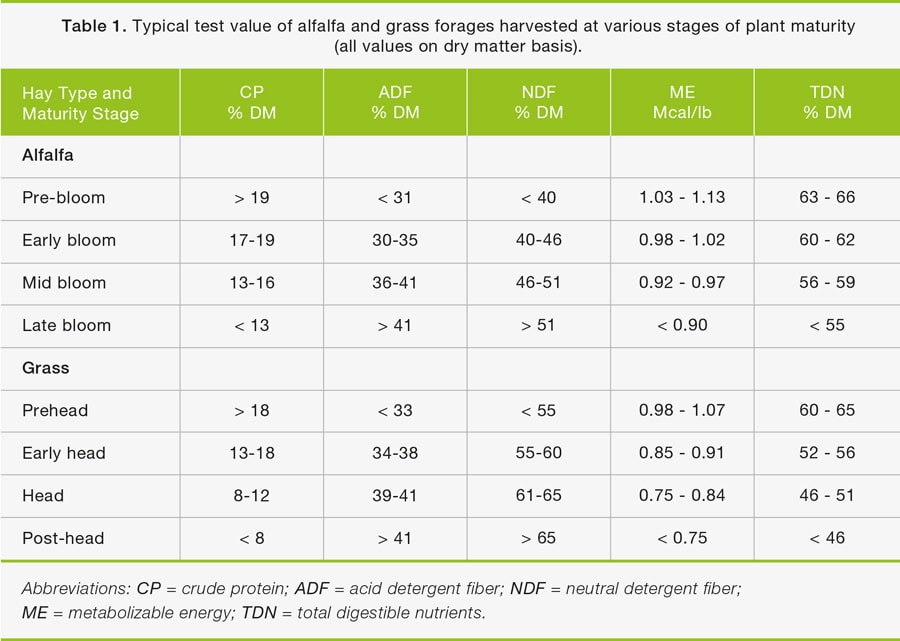
Crude Protein (CP). Forage protein content is a reasonable marker of forage quality, with more immature plants having greater protein content compared to mature plants (Table 1). Feed protein content (termed Crude Protein [CP]) is determined by measured total nitrogen content, then converted to a crude protein basis by multiplying by 6.25 (proteins are assumed to contain 16% nitrogen). Sufficient dietary protein (>8% DM) is necessary to facilitate microbial fermentation in forestomach and, if deficient, reduced dry matter intake will result. Crude protein alone is not sufficient to understand how the forage will meet animal protein needs.
 Unavailable or Bound Protein. Not all nitrogen in a feed is available to microbes or the animal. The portion of crude protein not capable of being degraded by the fermentation microbes or digested by the animal is termed “unavailable protein” or “bound protein.” The amount of nitrogen (or crude protein; N x 6.25) that is found in the acid detergent fiber residue is defined as ADIN (nitrogen) or ADIP (protein). This represents the nitrogen in a feed bound to the plant cell wall, which represents heat-damaged protein that is unavailable to both microbes and the animal. The Maillard reaction causes heat damage by covalently linking nitrogen from amino acids to sugar residues of the plant cell wall. Moisture and heat are needed to promote this reaction.
Soluble Crude Protein. Soluble Protein measures the total nitrogen in feed (expressed on percent of CP basis) that is potentially soluble in rumen fluid. Soluble protein contains both nonprotein nitrogen (NPN) and true protein compounds. These nitrogen sources are readily used by forestomach microbes for microbial protein production and contribute to a rapid increase in the forestomach ammonia pool. Fiber-fermenting bacteria are absolutely dependent upon the forestomach ammonia pool as their sole source of nitrogen for protein synthesis. Mature grasses may have low soluble protein, which may limit fiber digestion and intake.
Fiber Carbohydrates. Carbohydrates make up approximately 70% of the herbivore’s diet and consist of a diverse group of compounds. Typically plant carbohydrates are divided into two groups, fiber and non-fiber carbohydrates, based on their degradability characteristics. Fiber carbohydrates are associated with the rigid plant cell wall and moderately to slowly degraded by the forestomach microbes. Total plant cell wall carbohydrates are determined as neutral detergent fiber (NDF). A subset of NDF is acid detergent fiber (ADF), which measures the cellulose and other indigestible components of the plant cell wall. Both NDF and ADF will increase with plant growth and aging (see Table 1) and are good measures of forage quality when their values are lower. Relationships of NDF and ADF differ depending on whether the plant is a grass or a legume.
Degradable Carbohydrates. Those carbohydrates that are found in the plant cell cytoplasm (i.e., storage forms such as starch or sucrose) or the secondary plant cell wall are more readily fermented or digested. One method of defining these carbohydrates is calculating nonfiber carbohydrates (NFC), which comprise all carbohydrates in the plant not accounted for in the NDF fraction. The carbohydrates that make up NFC are quite diverse, as it includes sugars, starches, and fermentable neutral detergent soluble fiber. A directly measured parameter of degradable carbohydrates is nonstructural carbohydrates (NSC). This procedure enzymatically degrades starch and complex sugars into glucose molecules to determine the total sugar and starch content of a feed.
Minerals. One of the more important components of feed analysis is determining mineral content. Ash provides a perspective on total mineral content of the feed. Both macrominerals-calcium (Ca), phosphorus (P), magnesium (Mg), potassium (K), and sulfur (S)-and microminerals-iron (Fe), copper (Cu), manganese (Mn), and zinc (Zn)-should be determined by wet chemistry methods. Selenium can be determined at some forage laboratories; however, its cost is high, and one would be better off measuring selenium in blood samples. The use of near-infrared spectroscopy (NIR) method to determine forage/feed mineral content is not recommended, as mineral values are not adequately quantified. Additionally, molybdenum (Mo) should be requested due to its potential interaction with copper availability. Most labs will be able to measure all these minerals, though sulfur and Mo may require an additional cost.
A SYSTEMATIC APPROACH TO INTERPRETING FEED ANALYSIS REPORTS
A feed analysis report can be extremely overwhelming with all the abbreviations and numbers presented. Each laboratory has its own reporting format, which makes it more difficult if you use more than one laboratory for testing. Here is a systematic approach to reviewing a feed analysis report for determining forage quality:
1. Check moisture content of hay if below 15% (>85% dry matter). Ensiled forage will have higher moisture, and its amount will depend upon the storage method
2. Review Crude Protein and protein fractions
a. Crude protein should be a minimum of 8% if feeding forage only. Higher protein is better if you are feeding pregnant, lactating, or growing animals
b. Soluble protein should be a minimum of 25% and preferably 30-35%
c. Rumen degradable protein – Look for higher values (>65%)
3. Evaluate Fiber Carbohydrates
a. Calculate the ADF to NDF ratio. Values close to 0.6 or lower indicate a grass forage. Values close to 0.8 or above indicate a legume forage. Values in between indicate mixed forages
b. Grass forages with NDF > 65% should not be fed to higher-producing animals but could be used in maintenance and high body condition score animals
c. Legume forages with NDF > 50% are very mature and will decrease potential feed intake
d. If Lignin value is provided, calculate the lignin to NDF ratio as a percentage. With grasses, values < 8.5% will be more readily digested. With legumes, values < 17% will be more readily digested. Higher values within each forage type indicate a more lignified cell wall and more slowly fermented forage
4. Evaluate Degradable Carbohydrates
a. Review the NFC and NSC values for the forage or feed
b. With grass forage, a good NFC value would be 20-25%, whereas with legume forages the NFC will be much higher (35-45%), but this is mostly due to fermentable fiber from pectin substances
c. Starch content of forages is typically less than 3%.
5. Review Macrominerals
a. Calculate the calcium to phosphorus ratio. It should be 2:1 or slightly higher. Legume forages will be very high (> 6:1).
b. Check calcium content in grass forages and be sure it is above 0.45%. Higher values will be needed for lactating and growing animals.
c. If the phosphorus content is greater than the calcium content – DO NOT use! This will greatly increase potential for urinary calculi in males.
d. Forages with phosphorus content > 0.25% typically are over-fertilized. See if the potassium value is also increased.
e. Forage magnesium < 0.10% is low and typical of some grasses. Legumes typically have higher magnesium, at 0.2% or more
f. Forage potassium is always higher than required. In most cases, this is not a problem. Potassium values >2.5% are very problematic.
6. Evaluate trace mineral values
a. Typical iron content is between 100 and 300 ppm. Values over 1,000 ppm usually indicate soil contamination of the sample.
b. Manganese is much higher in grass than legume forages. A value around 40 ppm in forage is desired.
c. Zinc is typically low in all forages (<30 ppm).
d. Copper is variable depending upon geography. Forage copper is higher east of the Mississippi River (> 9 ppm). Hay harvested from dairy farms may have higher copper (>15 ppm) due to their use of copper sulfate footbaths. Potential toxicosis could occur with forage with > 20 ppm copper
e. Molybdenum concentration should be determined in all feeds due to its impact on copper status. High forage molybdenum is sporadic in many geographic regions. A copper to molybdenum ratio < 4:1 will risk possible copper deficiency issues. A high ratio (>16:1) places the animals at risk for copper toxicosis.
With this systematic approach to understanding the forage or feed analysis report, one can readily make informed decisions on the appropriateness of a forage for their feeding program or identify potential nutritional risks underlying an animal disease issue.
About Robert Van Saun
A professor of veterinary science and extension veterinarian with Pennsylvania State University, Dr. Robert Van Saun provides extension programs across species on various nutrition, animal health, and reproductive topics regionally, nationally, and internationally. His research interests include the role of nutrition in animal health and performance, especially pregnancy nutrition, and improving diagnostic tests to evaluate nutritional status.


